
LinkedIn profile templates
Before you fill anything in
The 4 things every LinkedIn profile needs to get recruiter attention
STEP 01
Photo + banner
Clear, recent headshot. Banner is a screenshot of your best project, not a stock image.
STEP 02
Headline + About
Headline = role + stack. About = impact numbers, not adjectives.
STEP 03
Experience + Projects
Bullet every role with action → result. Pin 3-5 projects with live links.
STEP 04
Skills + Endorsements
Pin the top 3 skills that match the JD. Endorse 2-3 peers to get returns.
Step 1 · Build your banner first
Make a LinkedIn cover photo that matches your profile
Your banner is the first thing a recruiter sees after your photo — yet most students leave it blank. Use our editor to pick a background, drop in your name, title, email and phone, choose a font, and export a 1584×396 PNG ready to upload.
- 3 ready-made templates: wood desk, blue network, minimal white
- Script or serif font, custom text colour
- Right-aligned (varsha) or centered (Praween) layout
- One-click PNG download at LinkedIn's recommended size

Track-specific templates
Pick your track. Copy the templates. Edit with your details.
Recruiters hiring full stack developers scan for shipping proof — apps you actually built and deployed, the stack you used, and the impact. Keep the headline keyword-dense, and the About focused on what you ship.
1. Headline
Keep it under 220 characters. Stack names + target role, separated by pipes. Recruiters search by tool.
LinkedIn Headline
Full Stack Developer | Next.js · React · Node.js · PostgreSQL · TypeScript | Building production-ready web apps end-to-end at ProTech Academy
2. About / Bio
4 short paragraphs. Lead with impact numbers, close with what you're looking for. Replace the bracketed details with yours.
LinkedIn About
Final-year CS student and Full Stack Developer in training at ProTech Academy, Belagavi.

I build responsive, accessible web applications end-to-end — from Figma to deploy. Recent work: a Next.js + Prisma dashboard that cut admin reporting time by 60% and a Node/Express REST API with JWT auth that handles 200+ daily requests.

Stack I work in daily: JavaScript, TypeScript, React, Next.js, Node.js, Express, PostgreSQL, Prisma, Tailwind CSS, and Vercel.

Currently open to full stack / front-end internship roles where I can ship real features with a small team. Happy to share code samples and walk through anything in my portfolio.
3. Projects to feature
Add these as separate entries under the Projects section, and pin the strongest one to your Featured area with a live link.
Project — Personal Portfolio Website
Personal Portfolio Website
Personal Project | 2025
Tools
Project — Admin Dashboard with Role-Based Access
Admin Dashboard with Role-Based Access
Course Project | 2025
Tools
Project — Real-Time Chat Application
Real-Time Chat Application
Personal Project | 2024
Tools
Project — E-commerce Storefront
E-commerce Storefront
Personal Project | 2025
Tools
4. Top skills to pin
LinkedIn lets you pin 3 skills to the top of your profile. Pick from this list — they map to common JD keywords.
5. First LinkedIn post idea
Post within 48 hours of building your profile. The first post is the hardest — copy this structure.
First post idea
Write a 150-word post titled "How I shipped my first Next.js app to production in 7 days". Include a screenshot, link to the live site, and 3 lessons learned (one of them being a mistake). Tags: #nextjs #webdev #100DaysOfCode
6. Certifications to add
- ProTech Academy — Full Stack Web Development (in progress / completed)
- FreeCodeCamp — Responsive Web Design (if completed)
- Any HackerRank / LeetCode badges in JavaScript or SQL
7. Profile-level tips
- Banner image: a screenshot of your best project with a 1-line title overlay (avoid generic stock photos).
- Custom URL: linkedin.com/in/firstname-lastname-city (no numbers, no underscores).
- Pin your top 3 skills — pick the ones that match the JD you want, not the ones you've 'heard of'.
- Add a Creator mode headline only if you actually post; otherwise switch back to standard.
- Request a recommendation from every internship mentor or project reviewer within 48 hours of finishing.
Data-driven BCA graduate positioning for entry-level Data Analyst roles. Lead with the tools recruiters search (Python, SQL, Excel, Power BI, Pandas) and back every claim with one of the three projects below — rows cleaned, dashboards shipped, business impact in plain language.
1. Headline
Keep it under 220 characters. Stack names + target role, separated by pipes. Recruiters search by tool.
LinkedIn Headline
Data Analyst | Proficient in Python | SQL | Excel | Power BI | Pandas | Data Visualization | Passionate about Turning Data into Actionable Insights
2. About / Bio
4 short paragraphs. Lead with impact numbers, close with what you're looking for. Replace the bracketed details with yours.
LinkedIn About
Data-driven and detail-oriented BCA graduate passionate about turning raw data into actionable insights. I specialize in data cleaning, exploratory analysis, and visualization using Python (Pandas, NumPy), SQL, Excel, and Power BI, with hands-on experience building interactive dashboards that support informed decision-making.

Through academic and independent projects, I've developed strong skills in identifying patterns, solving data-centric problems, and communicating findings in a clear, business-relevant way. I approach every project with curiosity and rigor — asking the right questions before diving into the numbers.

I'm currently seeking an entry-level Data Analyst role where I can apply my technical skill set, learn from experienced professionals, and contribute to data-driven strategies that create real business impact.

📊 Core skills: Python | SQL | Excel | Power BI | Pandas | NumPy | Data Visualization | Data Cleaning | Dashboard Development

Let's connect — I'm always open to conversations about data, analytics, and opportunities to grow.
3. Projects to feature
Add these as separate entries under the Projects section, and pin the strongest one to your Featured area with a live link.
Project — Retail Sales Analysis Dashboard
Retail Sales Analysis Dashboard
Capstone Project | Mar 2026
Overview
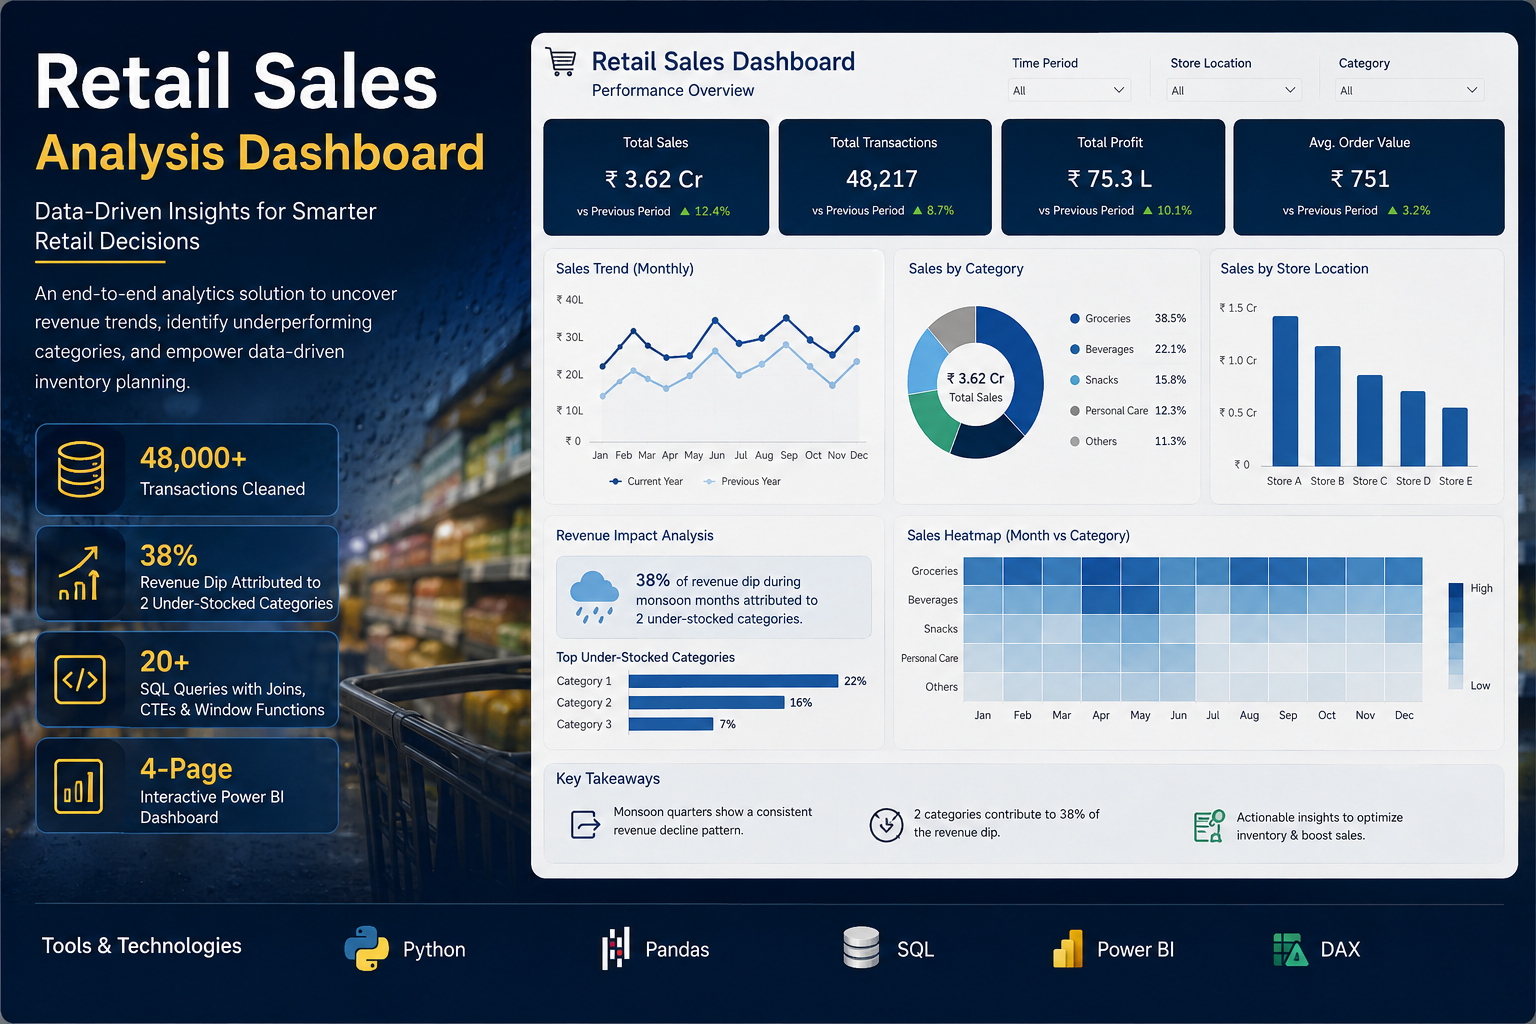
Built an end-to-end analytics solution for a local retail chain to diagnose a recurring revenue decline during monsoon quarters. Combined Python-based data cleaning, SQL analytics, and Power BI visualization to deliver a dashboard the owner adopted for weekly decision-making.
Key Metrics & Impact
- 48,000+ transactions cleaned and standardized across 3 years of sales history
- 38% of revenue dip attributed to 2 under-stocked categories
- 20+ SQL queries written with joins, CTEs, and window functions for trend analysis
- 4-page interactive Power BI dashboard with store-level, category-level, and seasonality drill-downs
What I Did
- Performed complete data cleaning: removed duplicates, fixed inconsistent date formats, imputed missing store codes, and standardized product categories
- Designed a SQL analytics pipeline to compute month-on-month growth, moving averages, and category-wise contribution to revenue
- Built a Power BI dashboard with slicers for time period, store location, and product category
- Presented findings to stakeholders with actionable recommendations on inventory planning
Tools
Project — Student Habits vs Academic Performance Study
Student Habits vs Academic Performance Study
Course Project | Jan 2026
Overview
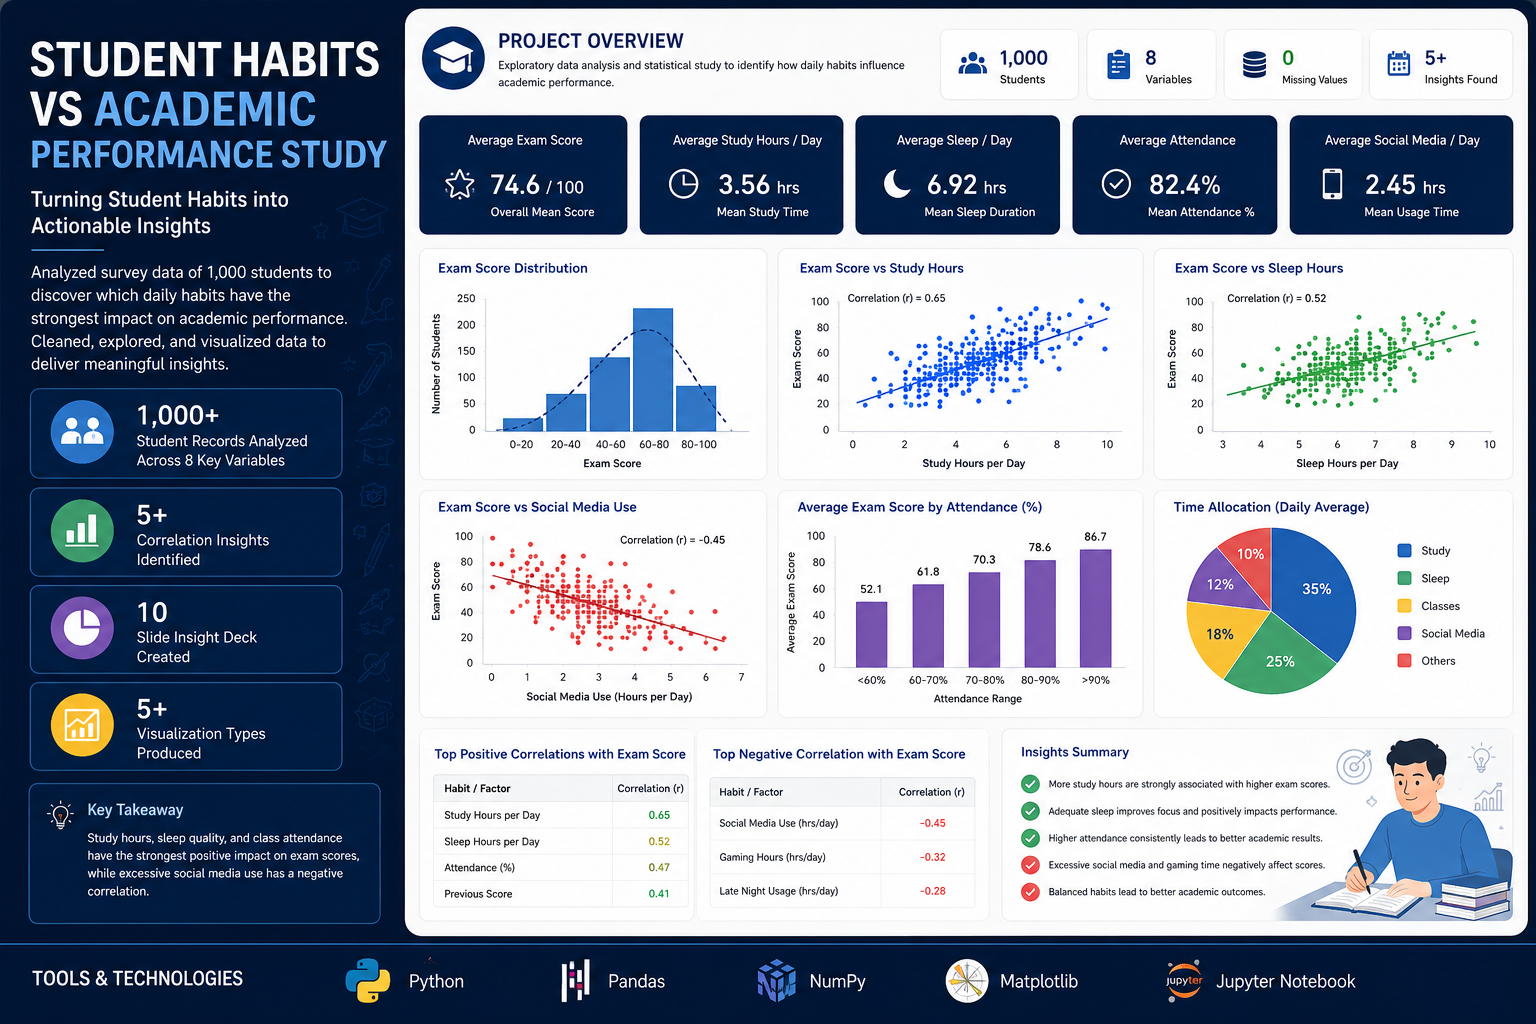
Conducted a statistical analysis of a 1,000-student dataset to uncover which daily habits most strongly correlate with exam performance. Transformed raw survey data into insights through exploratory data analysis, correlation analysis, and clear data storytelling.
Key Metrics & Impact
- 1,000 student records analyzed across 8 behavioral and academic variables
- 5+ correlation insights identified between study hours, sleep, attendance, social media use, and exam scores
- 10-slide insight deck created with annotated charts for non-technical audiences
- 5+ visualization types produced: histograms, scatter plots, bar charts, pie charts, and line charts
What I Did
- Cleaned and preprocessed survey data using Pandas: handled missing values, standardized categorical fields, and removed inconsistencies
- Applied NumPy and Pandas for descriptive statistics, correlation analysis, and conditional filtering
- Created publication-ready visualizations with Matplotlib, each paired with a written insight explaining the trend
- Wrote a final analytical report summarizing the relationship between habits and academic outcomes
Tools
Project — Employee Attrition & Retention Report
Employee Attrition & Retention Report
Course Project | Nov 2025
Overview
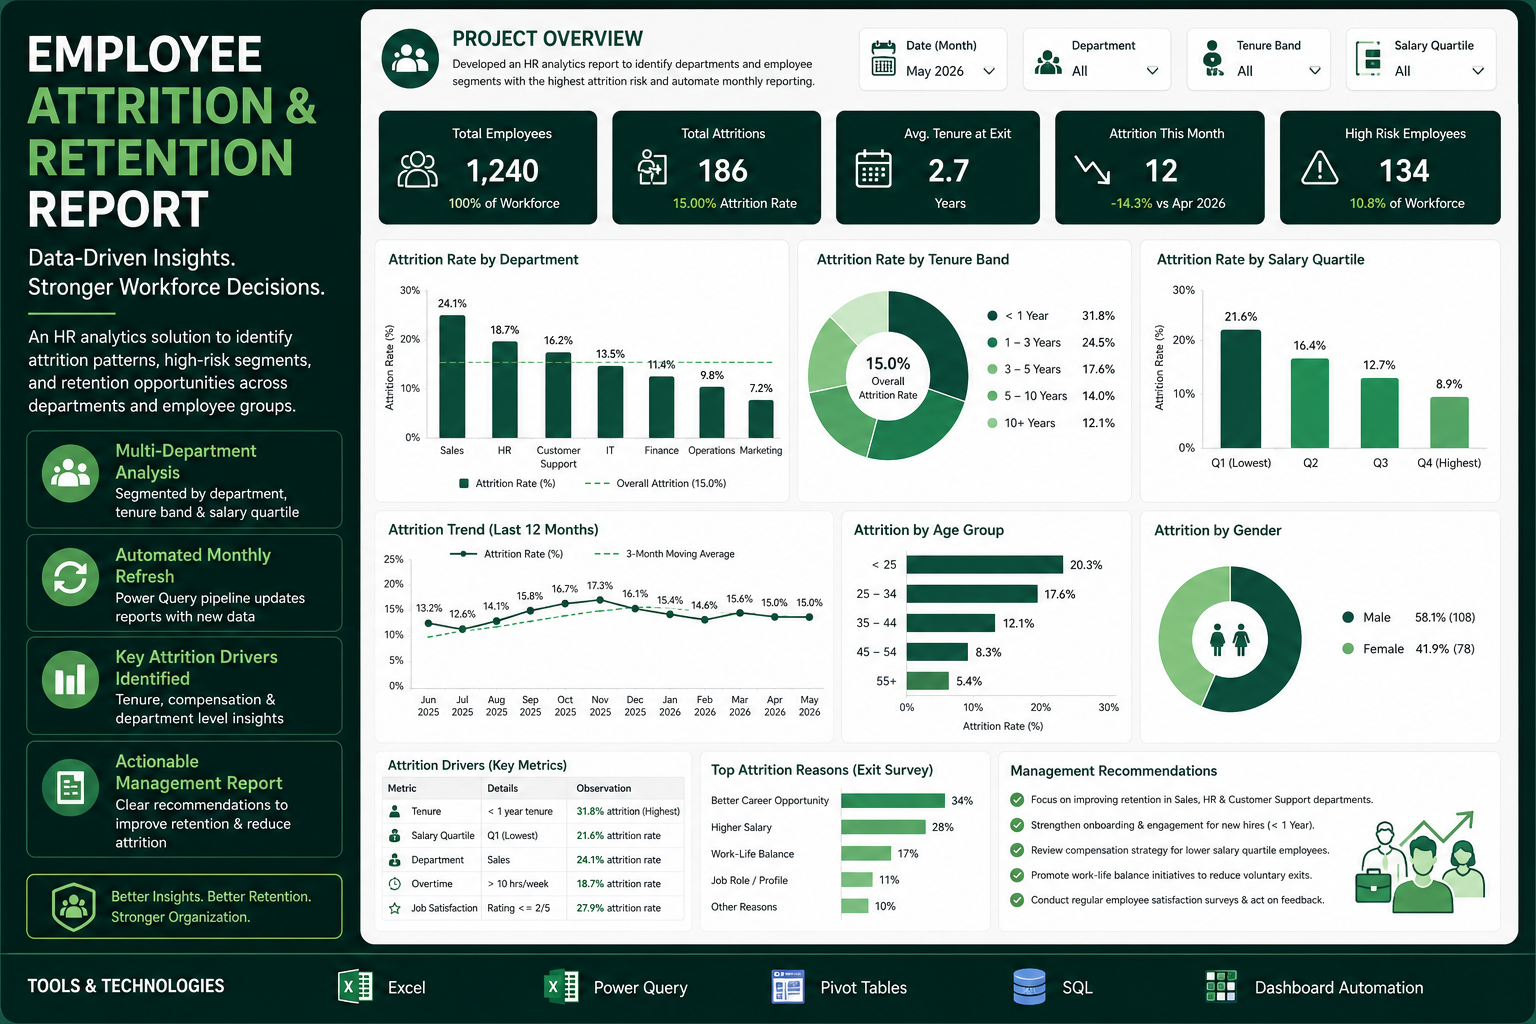
Developed an HR analytics report to identify departments and employee segments with the highest attrition risk. Automated the reporting workflow so the dataset could be refreshed monthly without manual rework.
Key Metrics & Impact
- Multi-department workforce dataset segmented by department, tenure band, and salary quartile
- Monthly refresh automated using Power Query, eliminating manual report preparation
- Attrition drivers identified across tenure, compensation, and department dimensions
- Pivot-table summaries and SQL-backed metrics used to validate findings
What I Did
- Cleaned HR records and built pivot-table summaries to compare attrition rates across departments
- Wrote SQL queries to calculate attrition percentages, average tenure at exit, and salary-band risk profiles
- Built a Power Query pipeline that automatically refreshes when new monthly data is added
- Delivered a concise management report highlighting at-risk departments and retention recommendations
Tools
4. Top skills to pin
LinkedIn lets you pin 3 skills to the top of your profile. Pick from this list — they map to common JD keywords.
5. First LinkedIn post idea
Post within 48 hours of building your profile. The first post is the hardest — copy this structure.
First post idea
Post a 4-slide carousel: Problem (messy sales data) → Process (cleaned in Pandas, 6 steps) → Insight (one chart) → Business recommendation. End with "what would you do next?" to drive comments. Tags: #dataanalytics #powerbi #sql
6. Certifications to add
- ProTech Academy — Data Analytics (in progress / completed)
- HackerRank SQL (Gold badge, if applicable)
- Microsoft PL-300 Power BI Data Analyst (if scheduled / completed)
7. Profile-level tips
- Banner: a clean mock dashboard (Power BI or Tableau Public screenshot) — not a stock photo.
- Featured section: pin the dashboard you built, the case-study write-up, and your resume PDF.
- Headline must include the tools (SQL, Excel, Power BI, Python) — recruiters search by tool name.
- About section: open with impact numbers (rows cleaned, hours saved, dashboards shipped) — not "I am a passionate data enthusiast".
- Add a Services section only if you freelance; otherwise keep the profile focused on roles you want.
Data Science recruiters look for model work, not tutorial certificates. Show 1-2 end-to-end projects (problem, data, model, metric, deploy), a Kaggle / GitHub trail, and clear math/stats literacy.
1. Headline
Keep it under 220 characters. Stack names + target role, separated by pipes. Recruiters search by tool.
LinkedIn Headline
Data Science Student | Python · scikit-learn · NLP · Deep Learning · SQL | Building end-to-end ML projects at ProTech Academy
2. About / Bio
4 short paragraphs. Lead with impact numbers, close with what you're looking for. Replace the bracketed details with yours.
LinkedIn About
Data Science student at ProTech Academy, Belagavi, with hands-on practice across the full ML lifecycle — problem framing, EDA, feature engineering, modeling, and deployment.

Recent work: a scikit-learn churn model that hit 0.87 ROC-AUC on a 50k-row telecom dataset, and a TensorFlow image classifier that reached 92% test accuracy on a 10-class subset of CIFAR-10.

Comfortable with: Python, scikit-learn, TensorFlow / Keras, Pandas, NumPy, Matplotlib, Seaborn, SQL, Jupyter, and model deployment via FastAPI + Hugging Face Spaces.

Open to Data Scientist / ML Engineer internship roles where I can take a model from notebook to a live endpoint.
3. Projects to feature
Add these as separate entries under the Projects section, and pin the strongest one to your Featured area with a live link.
Project — Customer Churn Prediction (scikit-learn)
Customer Churn Prediction (scikit-learn)
Capstone Project | 2025
Tools
Project — Sentiment Analysis on Product Reviews
Sentiment Analysis on Product Reviews
Course Project | 2025
Tools
Project — Image Classifier (TensorFlow / Keras)
Image Classifier (TensorFlow / Keras)
Course Project | 2024
Tools
Project — Kaggle Competition Walkthrough
Kaggle Competition Walkthrough
Personal Project | 2024
Tools
4. Top skills to pin
LinkedIn lets you pin 3 skills to the top of your profile. Pick from this list — they map to common JD keywords.
5. First LinkedIn post idea
Post within 48 hours of building your profile. The first post is the hardest — copy this structure.
First post idea
Write "From notebook to production: how I shipped my churn model as a FastAPI service in a weekend". Include the architecture diagram, the curl command, and one thing you'd improve. Tags: #MachineLearning #MLOps #DataScience
6. Certifications to add
- ProTech Academy — Data Science (in progress / completed)
- DeepLearning.AI TensorFlow Developer (if completed / scheduled)
- Kaggle competition medals or notebooks (link directly)
7. Profile-level tips
- Banner: an attention/architecture diagram from your best model — it reads as a Data Science profile in 1 second.
- Featured section: pin your GitHub, your best Kaggle notebook, and a 2-minute demo video.
- Headline should name the modelling stack (scikit-learn, TensorFlow, NLP) — recruiters filter on these.
- About: lead with one specific model + one metric + one dataset ("0.87 ROC-AUC on 50k rows"). Avoid generic phrases.
- Ask for recommendations from project reviewers, not from college professors — they read as more relevant.
Once you have finished
Mark this module complete
Once your LinkedIn profile is live with the headline, about, and at least one project pinned — come back to the Placement Preparation track and tick this module off your progress.